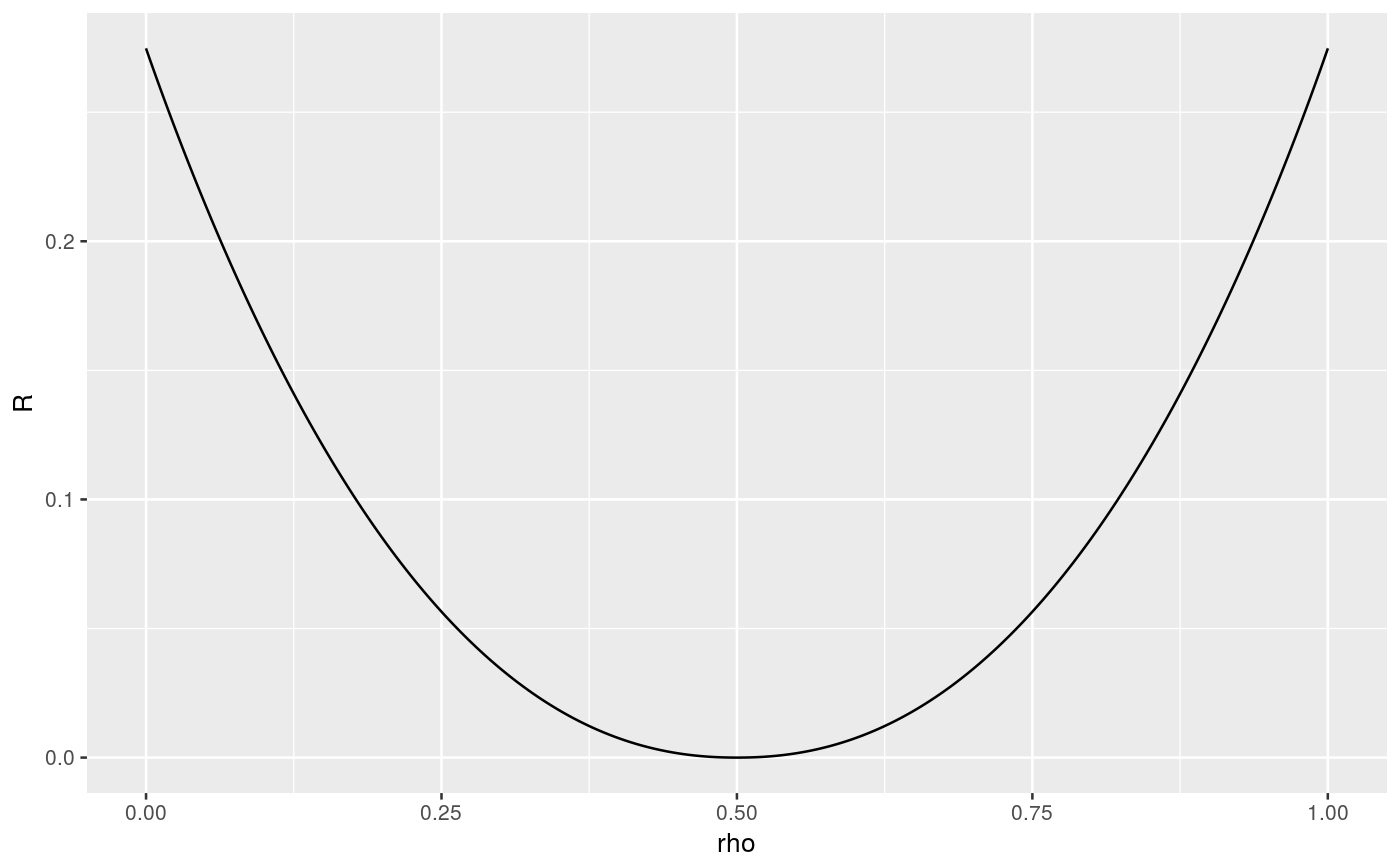
Large deviation rate function for index probability
rate produces a table and lookup function for the large deviation rate function
of the index (see accompanying vignette for definition).
rate(N = 1000)
Arguments
| N | number of intermediate points; size of resulting table |
|---|
Value
The output of rate is a list of four elements:
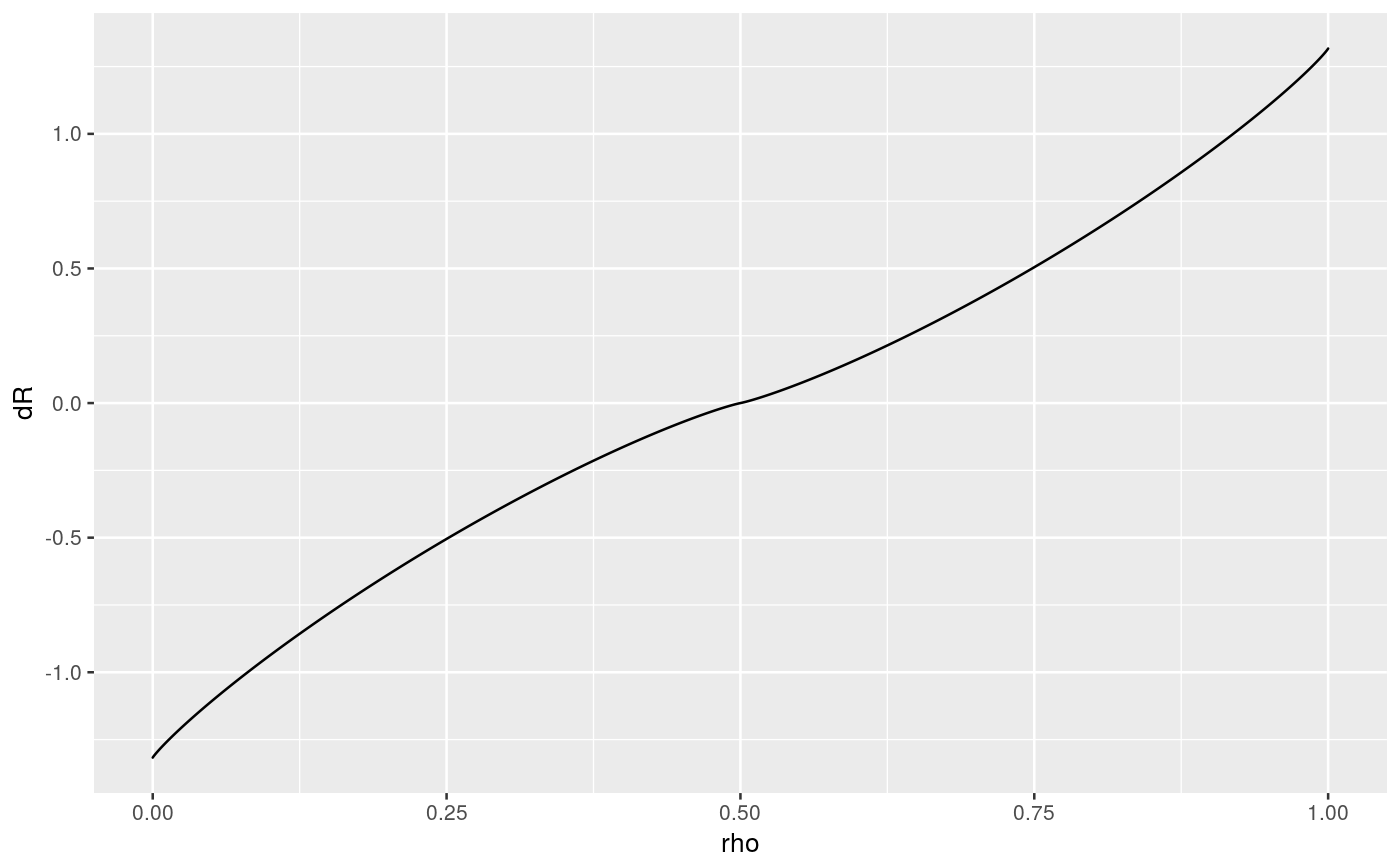
table: a table of function values withNelementstable: a table of function values withNelements for the derivativelkup_R: a corresponding lookup function for the rate function Rlkup_dR: a corresponding lookup functions for the derivative of R
See also
Package: symconivol
Examples
R <- rate()
ggplot(R$table, aes(x=rho,y=R)) + geom_line()ggplot(R$dtable, aes(x=rho,y=dR)) + geom_line()rho <- (0:10)/10
matrix(c(rho, R$lkup_R(rho), R$lkup_dR(rho) ),11,3)#>       [,1]          [,2]       [,3]
#>  [1,]  0.0  2.746522e-01 -1.3168985
#>  [2,]  0.1  1.631496e-01 -0.9364631
#>  [3,]  0.2  8.498533e-02 -0.6386220
#>  [4,]  0.3  3.427850e-02 -0.3817735
#>  [5,]  0.4  7.606010e-03 -0.1633829
#>  [6,]  0.5 -1.343760e-11  0.0000000
#>  [7,]  0.6  7.606010e-03  0.1633829
#>  [8,]  0.7  3.427850e-02  0.3817735
#>  [9,]  0.8  8.498533e-02  0.6386220
#> [10,]  0.9  1.631496e-01  0.9364631
#> [11,]  1.0  2.746522e-01  1.3168985