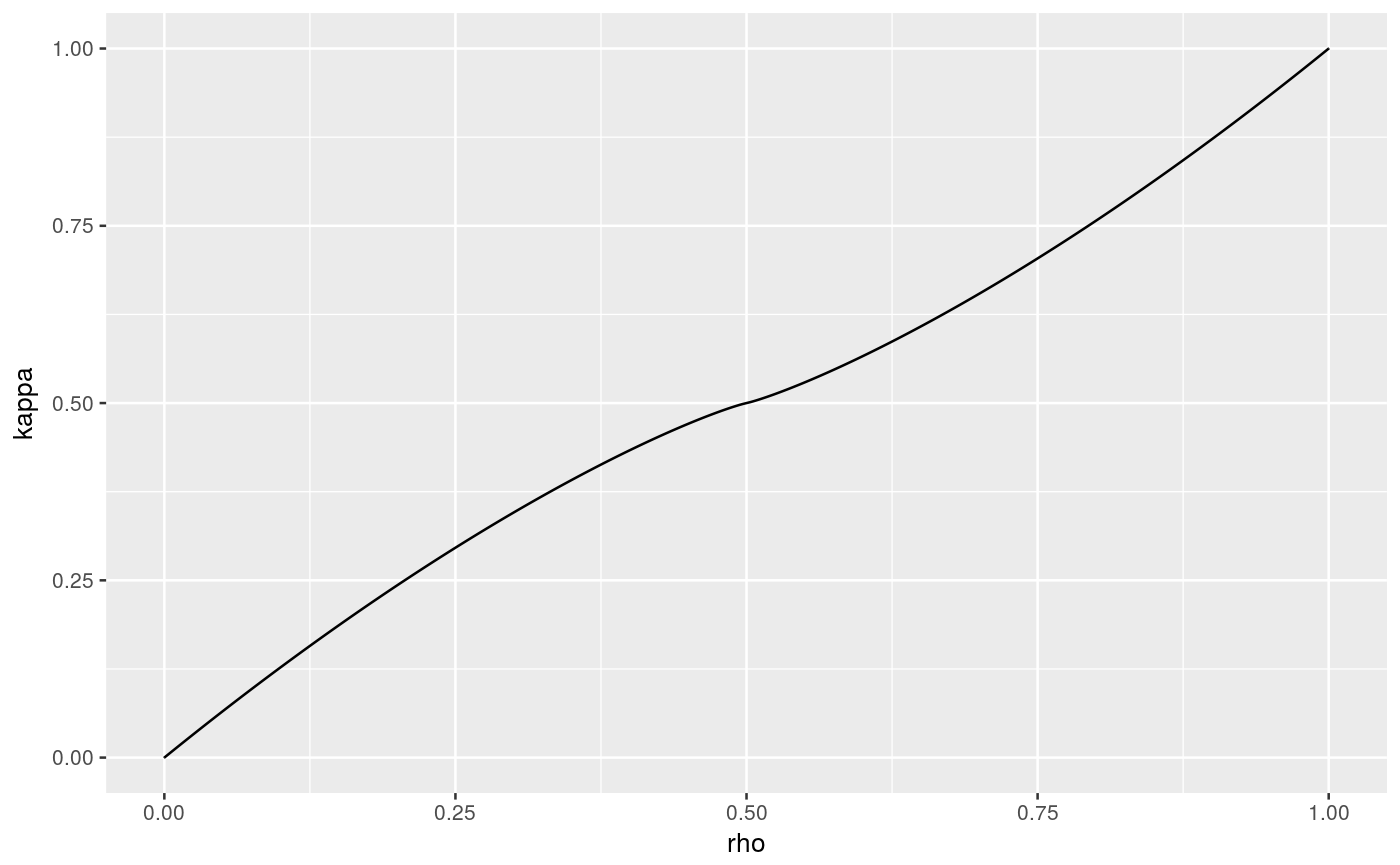
Leigh's curve
leigh produces a table and lookup functions for Leigh's curve
(see accompanying vignette for definition).
leigh(N = 1000)
Arguments
| N | number of intermediate points; size of resulting table |
|---|
Value
The output of leigh is a list of six elements:
table: a table of function values withNelementsdtable: a table of function values withNelements for the derivativelkup_rho: a corresponding lookup function for rho in terms of kappalkup_kappa: a corresponding lookup function for kappa in terms of rholkup_drho_dkappa: a corresponding lookup function for the partial derivative of rho in terms of kappalkup_dkappa_drho: a corresponding lookup function for the partial derivative of kappa in terms of rho
See also
Package: symconivol
Examples
L <- leigh()
ggplot(L$tab, aes(x=rho,y=kappa)) + geom_line()x <- (0:10)/10
matrix(c(x, L$lkup_rho(x) ),11,2)#>       [,1]          [,2]
#>  [1,]  0.0 -1.259628e-06
#>  [2,]  0.1  7.762827e-02
#>  [3,]  0.2  1.618063e-01
#>  [4,]  0.3  2.538881e-01
#>  [5,]  0.4  3.598310e-01
#>  [6,]  0.5  4.999999e-01
#>  [7,]  0.6  6.401690e-01
#>  [8,]  0.7  7.461119e-01
#>  [9,]  0.8  8.381937e-01
#> [10,]  0.9  9.223717e-01
#> [11,]  1.0  1.000001e+00matrix(c(x, L$lkup_kappa(x) ),11,2)#>       [,1]         [,2]
#>  [1,]  0.0 1.740784e-06
#>  [2,]  0.1 1.277354e-01
#>  [3,]  0.2 2.430591e-01
#>  [4,]  0.3 3.459488e-01
#>  [5,]  0.4 4.331761e-01
#>  [6,]  0.5 5.000001e-01
#>  [7,]  0.6 5.668239e-01
#>  [8,]  0.7 6.540512e-01
#>  [9,]  0.8 7.569409e-01
#> [10,]  0.9 8.722646e-01
#> [11,]  1.0 9.999983e-01