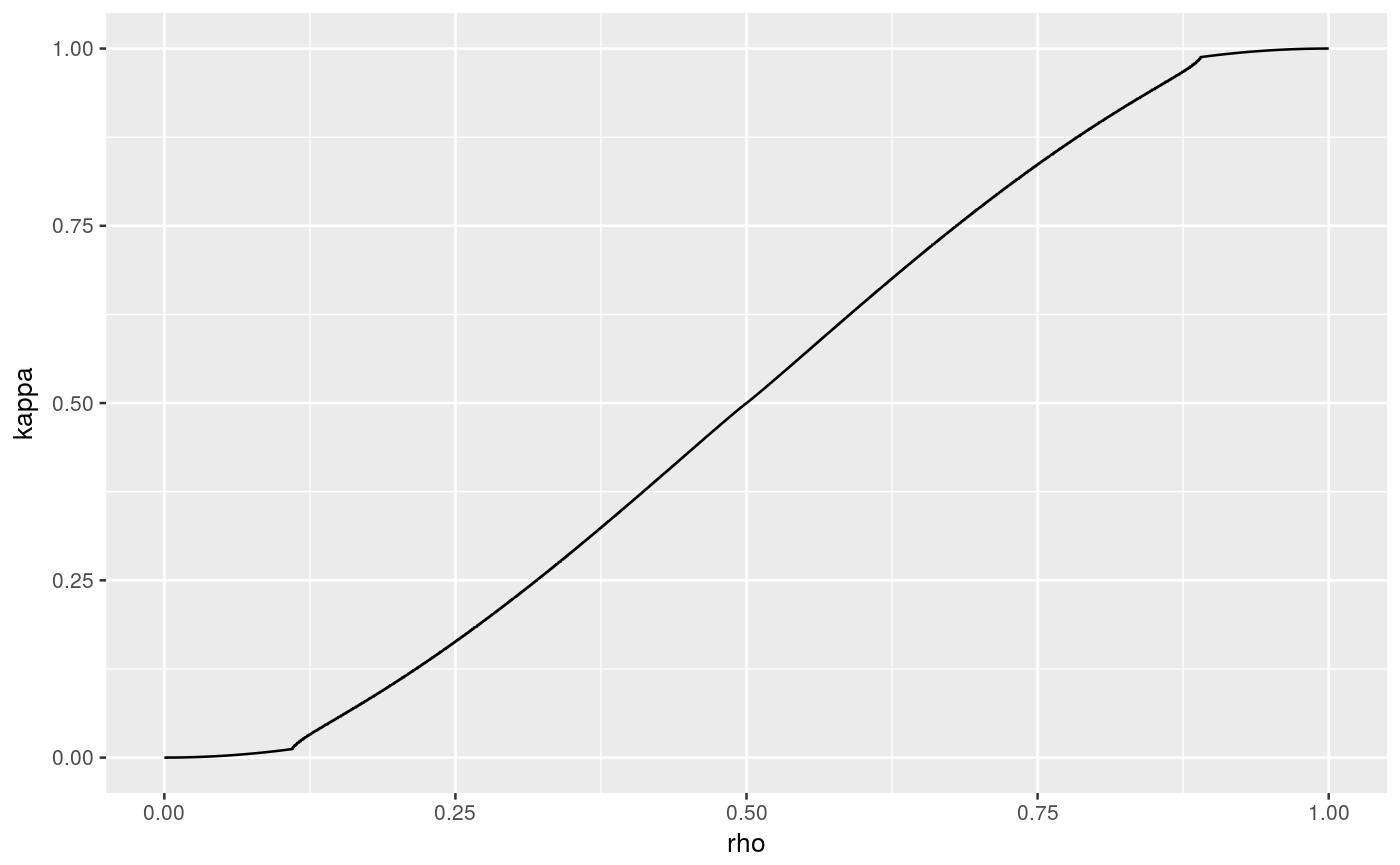
Estimated limit curve for the dimension normalized curvature measures
mu returns a pre-computed table and lookup functions for the
estimated limit curve for dimension normalized curvature measures
(see accompanying vignette for definition; we use C=0.2).
mu()
Value
The output of mu is a list of three elements:
table: a table of function valueslkup_rho: a corresponding lookup function for rho in terms of kappalkup_kappa: a corresponding lookup function for kappa in terms of rho
See also
Package: symconivol
Examples
M <- mu()
ggplot(M$table, aes(x=rho,y=kappa)) + geom_line()rho <- (0:10)/10
matrix(c(rho, M$lkup_kappa(rho)),11,2)#>       [,1]   [,2]
#>  [1,]  0.0 0.0000
#>  [2,]  0.1 0.0100
#>  [3,]  0.2 0.1076
#>  [4,]  0.3 0.2246
#>  [5,]  0.4 0.3590
#>  [6,]  0.5 0.5000
#>  [7,]  0.6 0.6407
#>  [8,]  0.7 0.7754
#>  [9,]  0.8 0.8919
#> [10,]  0.9 0.9900
#> [11,]  1.0 1.0000kappa <- (0:10)/10
matrix(c(M$lkup_rho(kappa), kappa),11,2)#>         [,1] [,2]
#>  [1,] 0.0000  0.0
#>  [2,] 0.1928  0.1
#>  [3,] 0.2801  0.2
#>  [4,] 0.3571  0.3
#>  [5,] 0.4288  0.4
#>  [6,] 0.5000  0.5
#>  [7,] 0.5712  0.6
#>  [8,] 0.6429  0.7
#>  [9,] 0.7199  0.8
#> [10,] 0.8072  0.9
#> [11,] 1.0000  1.0